Scientific modelling allows us to see the Tweed catchment as one dynamic system, with multiple ever-changing inputs, outputs and processes, all intrinsically connected and influenced by each other. Models can help us get a better understanding of the complex hydrology at work and how factors such as topography, soils, geology, and land-use overlap and play a role. In tandem with fieldwork, they will provide greater insight and help WADER to predict the impact of changing variables.
The WADER team is trialling a range of different models to find the best suited to analysing and predicting water quality in the Tweed catchment. The chosen model will divide the area into sub-catchments or ‘reaches’, into which are fed WADER’s field datasets as well as the latest data from the National Rivers Flow Archive (NRFA), the Met Office, the CEH UK Land Cover Map and Agri-census records (Defra Agricultural Census data of sheep, cattle, arable etc). This real-time and historic data on temperature, rainfall, evapotranspiration, land use and farming practice will allow the model to theorise actual (and predict future) pollution issues across the full catchment area.
Once set up, the model could easily demonstrate how changing land use, reduced nitrogen applications, local mitigation measures and also changing climate (increased temperature and / or rainfall) could affect the full extent of the river system. This will be invaluable for creating landscape-scale solutions and measuring the effectiveness of WADER’s work.
Modelling in Budle Bay
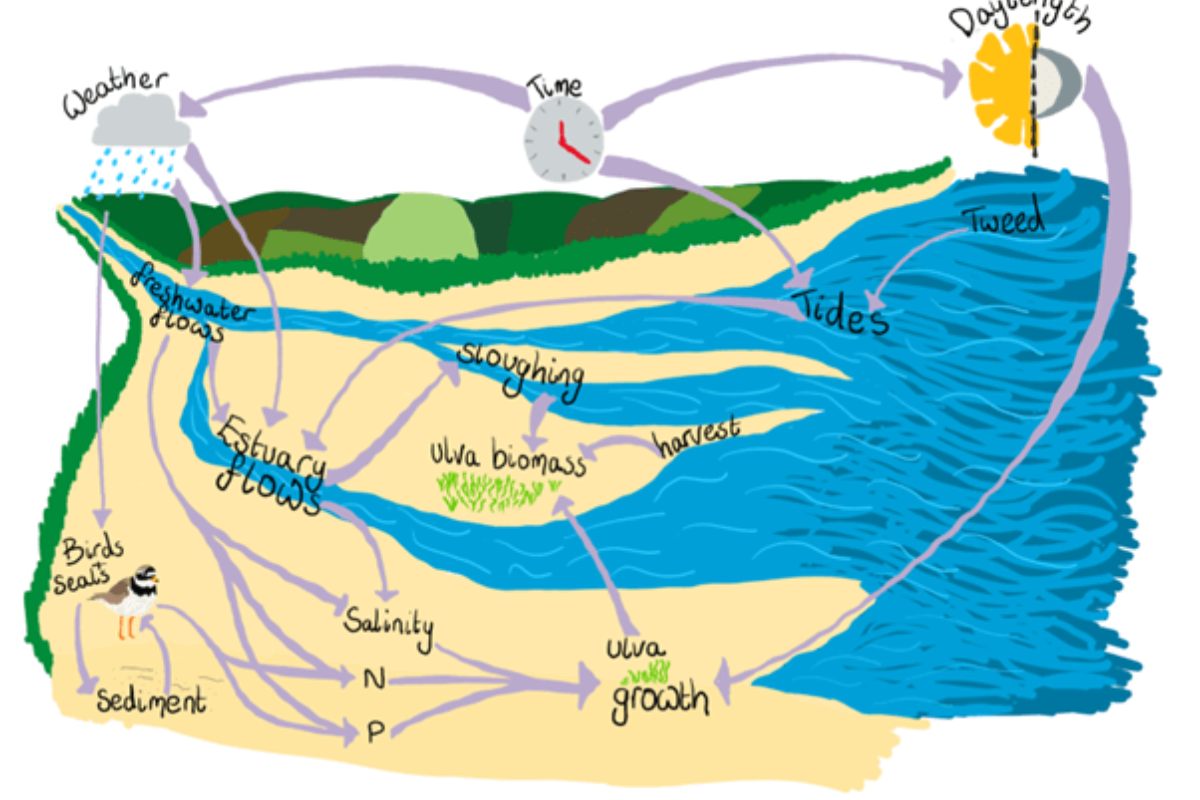
Using the same principles, Professor Steve Rushton and his team at Newcastle University have created a bespoke micro-model for the Budle Bay ecosystem. It will help us understand the specific reasons for the algal bloom and predict how dynamic environmental variables play a role. Like with the catchment model, it will provide insight into the complex range of biological, chemical and physical processes at play over varying space and time scales and be a vital accompaniment to lab and field work.
Macroalgae growth is driven by temperature, salinity, nitrogen concentration in surrounding water, sunlight hours and changes in water levels. The model splits the estuary into grid cells of 50m by 50m and uses coastal bathymetry and tidal fluxes to estimate actual flows of nitrate pollution from the sea, freshwater streams, birds and sewage flows. When processed alongside field and Met Office data, the model will estimate the relative contribution of different nitrate sources to the relative growth of macroalgae in each cell.
Gallery
Please take a look at, and enjoy, the latest images of our Modelling project.
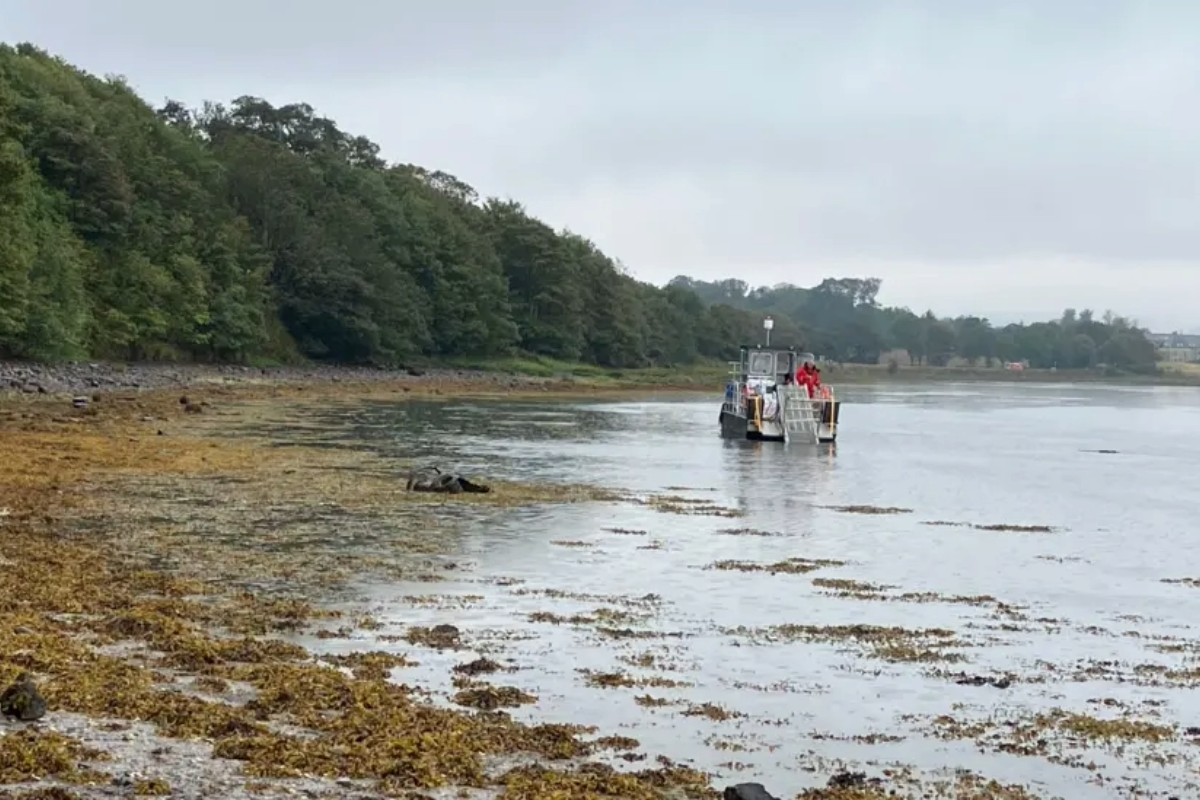
WADER has been trialling a variety of sensitive methods to remove the algal mats, with a view to potentially extracting up to 58.5 tonnes of algal biomass from Budle Bay.
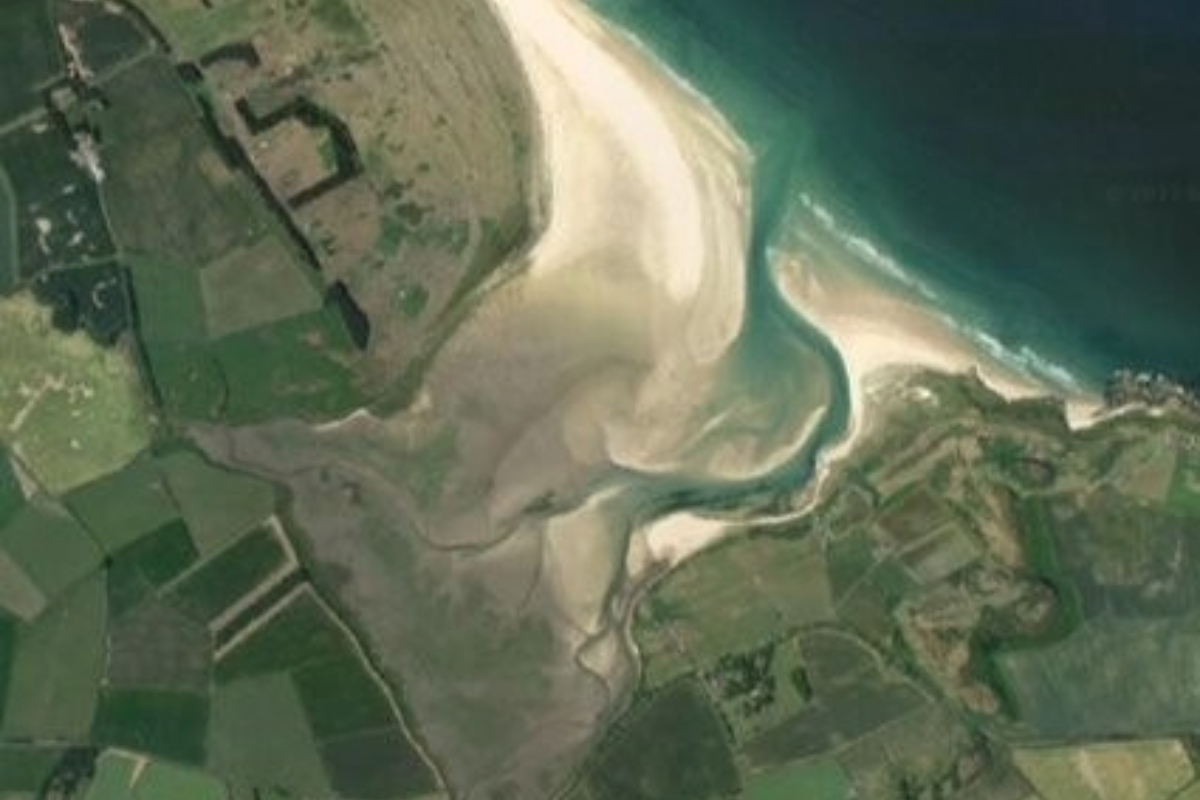
Known as ‘macroalgae’, these dense and extensive mats cause huge problems for nature and biodiversity. View our maps to show the extent of macroalgae in the project area.
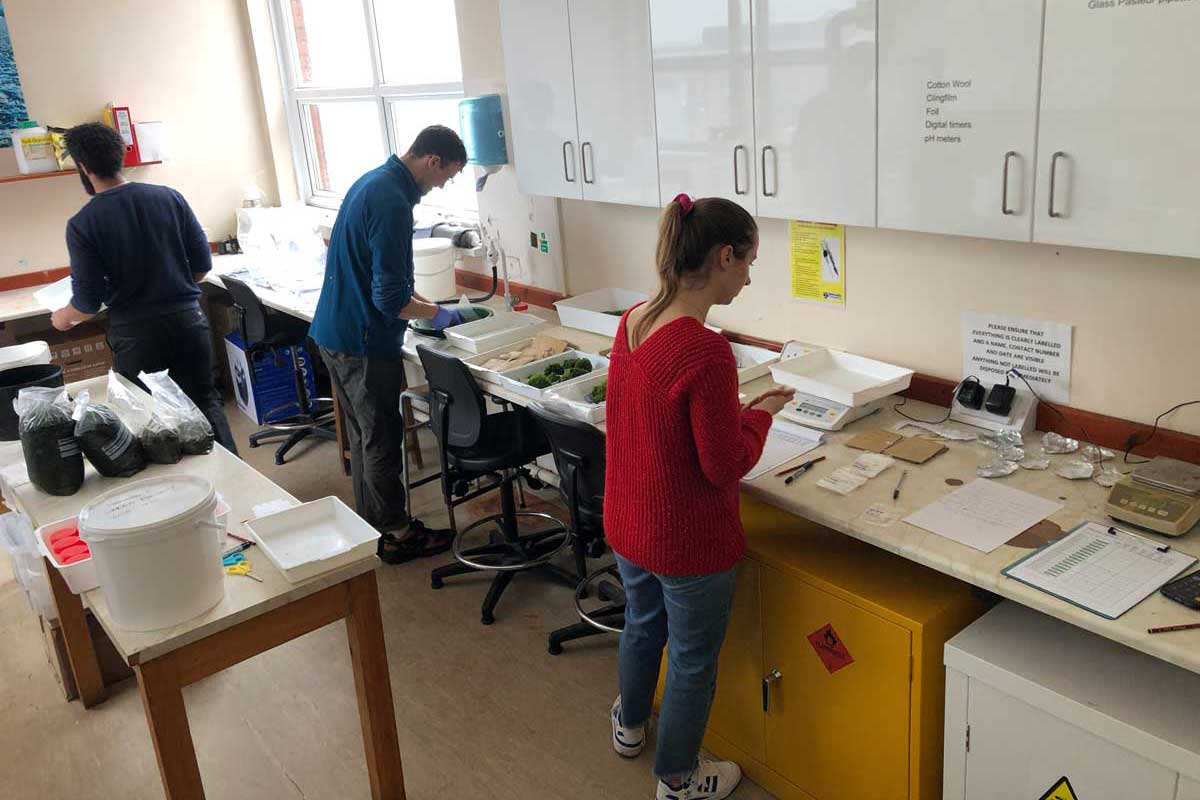
WADER is conducting in-depth lab analysis of the algae alongside scientific modelling to better understand what is causing excessive macroalgal growth. Find out more about this project.
WADER has been trialling a variety of sensitive methods to remove the algal mats, with a view to potentially extracting up to 58.5 tonnes of algal biomass from Budle Bay.
Known as ‘macroalgae’, these dense and extensive mats cause huge problems for nature and biodiversity. View our maps to show the extent of macroalgae in the project area.
WADER is conducting in-depth lab analysis of the algae alongside scientific modelling to better understand what is causing excessive macroalgal growth. Find out more about this project.